
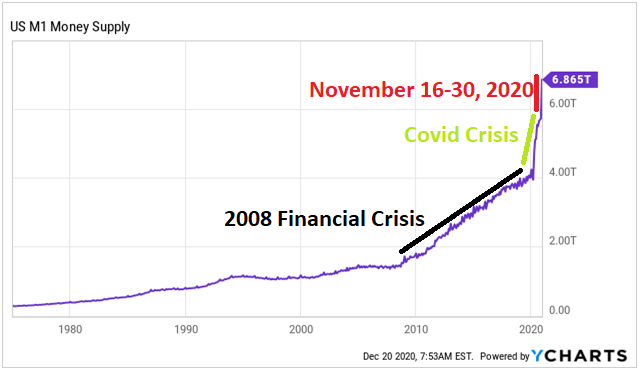
Dollar Cash Supply Rockets 25% in Just Two Weeks
The only "exponential growth" of 2020 has been in the Federal Reserve notes flying around


- The amount of dollars in checking accounts in the US banking system exploded by 25% from Nov. 16-30, the fastest rate in history, including the immediate post COVID-19 printing bonanza.
- The money, an unbelievable $1.3 trillion, came from savings accounts. The transfer coincides with the expiration of most mortgage forbearance plans and the shipping container fiasco at international ports.
- Checking deposits are used for payment, savings deposits for investment, suggesting more spending and less investment, meaning stagflation is about to pick up in a big way.
These numbers almost seem like a joke, but there’s nothing funny about this. From Nov. 16 to Nov. 30 the amount of dollars in checking accounts in the US banking system rose by an unbelievable 25%. In the space of just two weeks, the narrow money supply termed M1 increased by a whopping $1.3 trillion, from $5.534 trillion to $6.865 trillion. To get a sense of proportion here, or lack thereof as the case may be, here’s the broad view since 1975.
Where is all this money coming from? The answer to that question can be found in this next chart, of Non-M1 M2. That is, the broad money supply M2, excluding M1. This consists mostly of savings deposits.
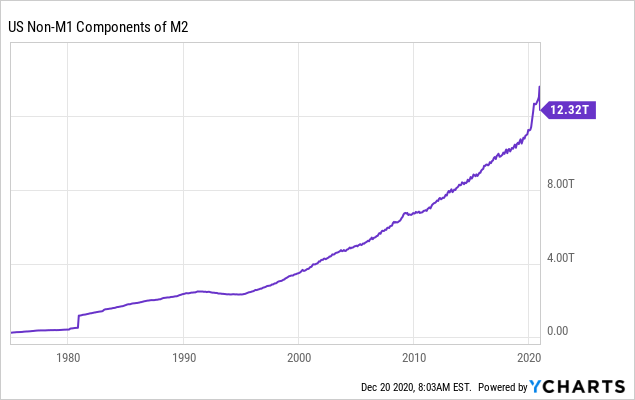
Notice the plunge at the end of the chart. We can see here that over the same two-week period, savings deposits contracted by about the same $1.3 trillion, from a high of $13.6 trillion on Nov. 16 to $12.3 trillion by Nov. 30. An absolutely unprecedented amount of money is suddenly being vacuumed out of savings and into checking. The obvious question is why, and what are the implications?
Major Consumer Price Inflation Imminent
People, institutions or individuals, generally pay their bills with checking deposits. Savings, on the other hand, are used mainly for investment purposes. When an individual on the retail level or a corporation or large financial institution needs to pay a bill, the money is first taken from savings and transferred to checking.
For such a gargantuan amount of money to have been transferred from savings to checking in just two weeks likely means there are suddenly a whole lot of big bills coming due all at the same time. I’ll get into what that may be in a second. First, echoing this, here’s Investopedia’s explanation of the difference between the broad M2 money supply and the narrower M1 (emphasis mine): M2 is a broader money classification than M1 because it includes assets that are highly liquid but are not cash.
A consumer or business typically doesn’t use savings deposits and other non-M1 components of M2 when making purchases or paying bills, but it could convert them to cash in relatively short order. So what bills are coming due all at the same time now? This is from Fitch, in a note dated Nov. 12, just before the massive $1.3 trillion transfer of funds began (emphasis mine): The vast majority of forbearance plans that were granted in the first few months of the pandemic are expiring now, and borrowers will need to resume regular payments and make up for missed payments. With slowing economic growth and elevated unemployment, weaker borrowers carrying more debt will fall delinquent, with loan performance expected to deteriorate.
There has not been widespread extension of debt relief programs, although some sectors have selectively offered forbearance beyond the original terms. And so it seems that this absolutely massive amount of deposits is being moved to pay bills that have been suspended since around March.
Next question, what are the implications of this exodus from savings into checking? Well, if checking deposits are used for spending and savings deposits for investment, this means that there are now about $1.3 trillion more dollars available for spending now than there were on Nov. 16, and $1.3 trillion less for investment. Logically, that would at some point translate to higher consumer price inflation and lower asset prices.
Checkings vs Savings During Stagflation vs High Growth Periods
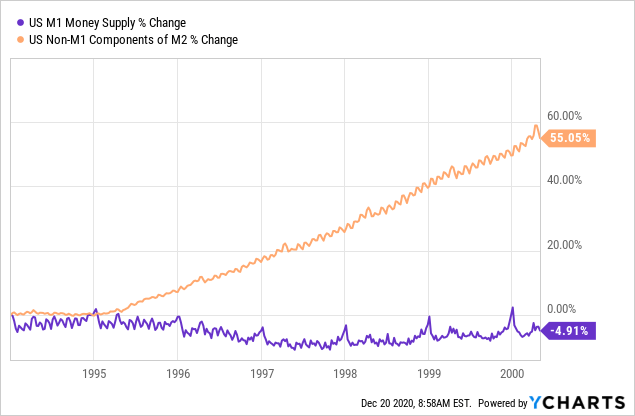
That’s all nice and logical in theory, but where’s the empirical evidence? The charts below oblige. This first one is M1 (checking in blue) vs Non-M1 M2 (savings in orange) during the stagflationary period of the 1970s.
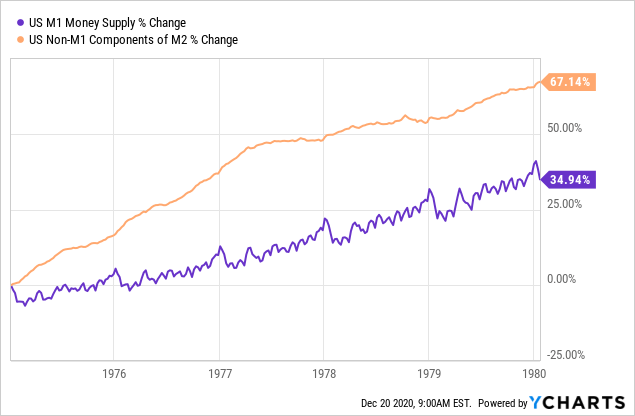
On its own this chart looks normal. Narrow money climbed by about a third during the stagflation of the 1970s, and savings by about two thirds. Now let’s look a little closer. Let’s zoom in to the peak stagflationary period of 1978-1980 when the gold price roughly quintupled:
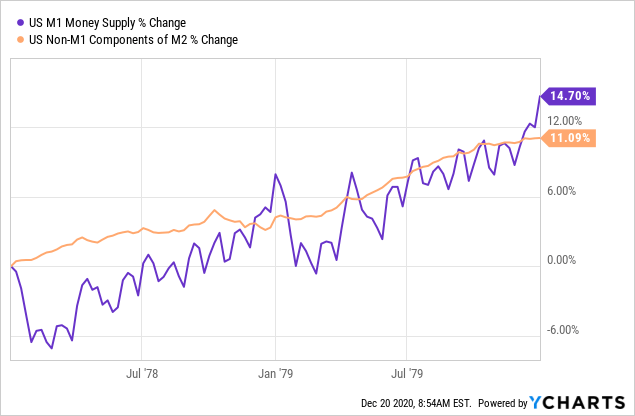
As you can see above, during the peak price inflationary period of the modern era when the official CPI inflation rate peaked out at 15% annual, checking deposit growth actually outpaced savings growth. Now let’s look at a high-growth low-consumer-price-inflation period. Here’s what happened in the US banking system during the roaring 1990s boom:
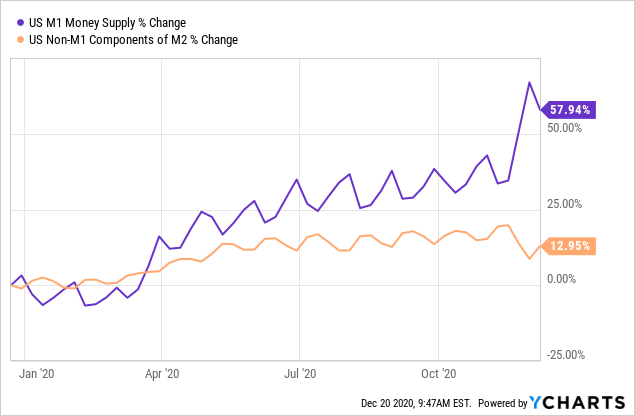
The narrow money supply actually fell over a six-year period, while savings deposits rocketed 55%. Inflation was low, and asset prices soared. By implication then, plummeting savings and skyrocketing checking as we have just seen from Nov. 16-30 would signal much higher consumer price inflation together with stagnant or falling asset prices.
Consider the enormousness of these figures in perspective: Checking account money from Nov. 16-30 expanded by about the same amount percentage-wise as from the entire period of 1974-1980. Could this be a glitch?
Maybe all this money will flood right back into savings in the weeks ahead and this is just some kind of temporary lurch caused by the extraordinary monetary movements since the COVID-19 era began. There’s some theoretical validity to that guess, as checking and savings typically yo-yo back and forth week to week. Some of that $1.3 trillion in checking deposits has indeed gone back into savings last week.
But as you can see from the chart above, not much. Checkable payments tend to be transferred into savings during the first half of each month, and some savings tend to be disgorged back into checking in order to make payments during the second half of each month.
On a monthly basis the move down in M1 and back into savings tends to retrace at least 75% of the previous M1 advance. So far the latest move down has retraced only 27% of the previous all time record $1.3 trillion move higher.
Judging by short-term cyclical patterns, there should be one more week of decline in M1 back into savings until the next M1 advance begins. If stronger price inflation is imminent, we should see progressively weaker retracements in M1 back into savings as that would signal economic actors are more willing to part with those checkable dollars for goods and services rather than move them back into savings for investment purposes. It would signal a fall in the demand to hold cash balances generally, which would push up the general price level.
Inflationary Signs Abound in Commodities
We already are seeing signs of higher consumer price inflation in the commodities sector, especially food commodities, concurrent with a fall in the dollar index on the foreign exchanges. Soybeans for one have broken through their 2016 high at $1,208, closing last week at $1,220. Copper has been up 29 of the last 39 weeks since March and is at seven-year highs.
And it’s not just prices themselves, but the fact that many commodities are stuck in backwardation – meaning spot prices are higher than futures prices for these commodities – despite no supply shortages. In a previous article I explained why a collapsing dollar would lead to backwardation across all commodities regardless of shortages, and this seems to be already happening.
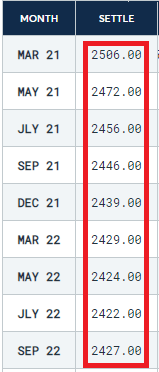
For background on backwardation I would highly recommend perusing that one. Cocoa, for example, is in backwardation despite abundant supplies. Below are the latest cocoa futures prices current to Dec. 18, nearest contract more expensive than futures:
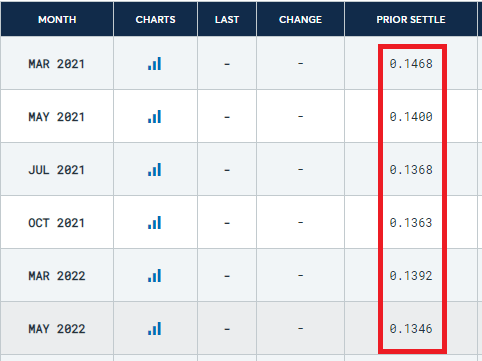
Here’s the latest futures table for sugar, Dec. 18, also in backwardation despite abundant supply:
Also in backwardation as of Dec. 18 are lumber, oats, corn, and class III milk. If backwardation is persisting in these commodities despite no physical shortages, it means there is dollar flight. Commodities traders are more anxious to get out of dollars sooner rather than later and trade them for tangible goods as soon as possible.
The next $2.3 trillion spending tranche could smash the dollar
In the meantime, preliminary reports are that Congress has agreed on a second COVID-19 bailout package around $900 billion. Add a $1.4 trillion omnibus spending package, and Congress is about to spend another $2.3 trillion at a time when the dollar index is showing significant weakness.
The index is close to breaking the 2018 lows at 88.15. If that level is broken while Congress is spending trillions more while at the same time record amounts of money are pouring out of savings and into checking to make back payments, serious consumer price inflation could be only a few short months away.
For those who do not have healthy positions in gold and silver to hedge against an upside explosion in consumer prices that may be imminent, time is running out. Gold appears to have bottomed a month ago. Silver is leading gold to the upside. How much higher do precious metals prices have to go before the world catches on and the dollar gets dumped across the world? Best not to guess and just get in now.
Source: Seeking Alpha
Happy New Year